A popular narrative is that the COVID pandemic shutdowns made things worse for public schools, so we should cut them some slack. But there are two problems with this.
First, the narrative is not supported by the data. Scores were already decreasing (for reading) or stagnant (for math) before the pandemic started. It’s not like there was progress to be interrupted.
Second, the amount of slack that was already given to public schools over the several decades preceding the shutdowns is nearly beyond belief. There hasn’t been a time since the NAEP tests started (half a century ago) when it hasn’t been reasonably accurate to say: About half of kids in public schools are performing below the lowest levels of proficiency in reading and math. This is true no matter where you look, and no matter when you look.
The one score on which public schools have made substantial gains is in dollars spent per student. Currently, the per-student cost of a K-12 education exceeds the median cost of a house in many school districts.
For homeschooling parents, there is good news, and there is bad news. The good news is: Whatever you’re doing, it’s likely to be better than what they’re doing in the public schools, because it could hardly be worse.
The bad news is: Even if your own children are educated properly, they will still be surrounded by generations of public-school graduates, and will have to pay for an increasingly dysfunctional and expensive public school system.
Below, we take an in-depth look at what happened to scores on the New Hampshire Statewide Assessment (SAS), the test formerly known as the Scholastic Aptitude Test (SAT), and the National Assessment of Educational Progress (NAEP) before, during, and after the pandemic shutdowns. We also look at the per-student cost of K-12 education in New Hampshire over the same period.
The NH SAS
The New Hampshire Statewide Assessment System (NH SAS) is administered yearly to students attending traditional public and charter schools in grades 3-8. The SAT is administered to NH students in grade 11 -- it’s free, and it’s required.
Parents may exempt their child from taking these tests. They do not have to supply a reason, and the school has to provide an educational activity for the student to do during the period their classmates are taking the assessment. These tests are not used as graduation requirements.
There is no minimum performance required of students — except inasmuch as RSA 193-H:2 requires public schools to have "all pupils at the proficient level or above on the statewide assessment.”
No school in New Hampshire is in compliance with this law. We might ask what purpose is served by these tests, but that is not the purpose of this review.
The New Hampshire Department of Education (NH DOE) has a record of statewide assessment data since 2016, which includes the NH SAS (grades 3-8) and the SAT (grade 11). The tests were not administered in 2020 because of school shutdowns due to the COVID pandemic. We’ll call this the shutdown year.
In what follows, we will use the phrase ‘the score’ to refer to ‘the percentage of students performing at or above the most basic level of proficiency’ on any given test.
Summary of NH SAS Scores since 2016
The following chart shows an overall summary of the score on the state standardized tests in grades 3-8 and 11 in English Language Arts (ELA) and Mathematics.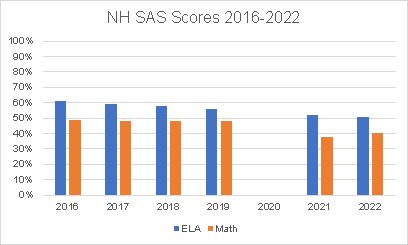
We see that ELA scores (blue) have been dropping linearly since 2016. (That is, we can draw a nearly straight line connecting the tops of all the blue bars.) In 2016, the score was just over 60%. (This means that nearly 40% -- that is, 4 out of 10 students -- performed below proficiency). In 2022, the score was about 50%. There was no extra drop after the shutdown for ELA. In other words, ELA scores seem to be just where they would be anyway, if the shutdown had never happened.
Math scores (orange) tell a different story. The score was just below 50% for all four years prior to the shutdown. After the shutdown it dropped to just under 40% and remained there in 2022. The scores were bad before, and are worse now. So, math scores show a marked decline after the shutdown.
(It’s just speculation, but this is consistent with the idea that students forgot the math they’d learned earlier. Which is another way of saying that they hadn’t really learned it.)
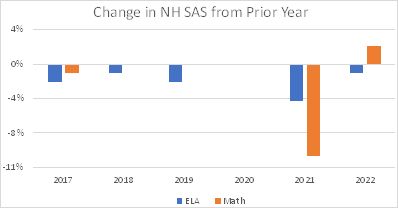
It might be helpful to view how these scores changed from year to year. The numbers in the chart below are computed by subtracting the previous year from the current year. (The difference shown in 2021 was from 2019, since the test wasn’t given in 2020.)
We can see that there’s a decrease in the ELA score (blue) every year, both before and after the shutdown. As described earlier, scores for ELA were dropping before the shutdown and continued in the same fashion into 2021. The drop from 2019 to 2021 appears large because it represents two years of decline, instead of just one.
The math score (orange) was approximately the same for each year before the shutdown (which is why you can’t see any orange bars for 2018 and 2019). Then there is a large (10%) drop in the score the year after the shutdown, followed by an increase in the score two years after the shutdown.
Individual Grades
Now let’s look at grades 3-8 and 11 individually to see if that tells a different story.
The chart below shows the score for ELA alone. It shows a 5-year progression for each grade, made up of 2 bars (for 2018 and 2019), a space (for the 2020 the shutdown year), and 2 more bars (for 2021 and 2022). We see that in each of grades 3 through 8 there’s a drop in scores after the shutdown year, though sometimes not by very much (e.g., grade 6). That’s consistent with the overall scores for grades 3-8, discussed above. However, grade 11 shows consistent scores before and after the shutdown, which is different from the overall scores shown earlier.
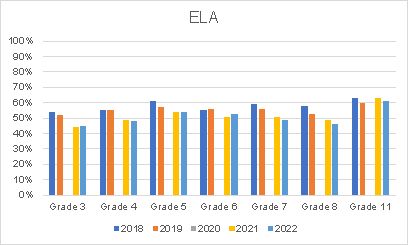
Students in grade 11 take the SAT, which is a different test from the NH SAS, and not directly comparable, even though the state combines them in its overall summary. Also, students take no standardized test in grades 9 and 10.
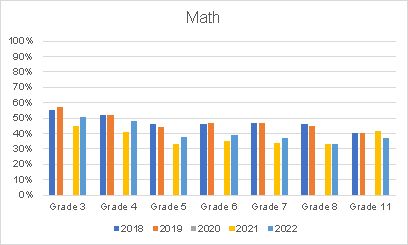
Math scores in the individual grades drop after the shutdown each year in grades 3 through 8 (yellow is below orange), but then the numbers start to rise (compare light blue to yellow). This is different from the overall scores in math. More specifically, the math score goes down after 3rd grade and remains static in the middle grades (look at any one color across grades 5-8 in the math graph below).
There is also an exception for grade 11 for SAT math, where the numbers remain at about the same levels, hovering at around 40%. (Again, that’s 6 out of every 10 students performing below proficiency).
Notes
- None of the scores are good.
- The providers of the NH SAS have done formal analyses of content validity to make sure it tests the content covered in the NH College and Career Ready Standards that teachers are required to teach each year. That is, it tests what it’s supposed to be testing.
- The NH SAS is not a high stakes test. That means that nothing hangs on a student’s score. Students who care about their test grades will try to perform well; those who don’t may just fill in bubbles.
- For students who don’t plan to go to college, the SAT is likewise not a high stakes test.
NAEP: The Nation’s Report Card
The National Assessment of Educational Progress (NAEP, pronounced “nape”) is often called The Nation's Report Card. It is the largest nationally representative and continuing assessment of what students in public schools in the United States know and are able to do in various subjects in grades 4, 8, and 12.
Since 1969, NAEP has been a common measure of student achievement across the country in mathematics, reading, science, and many other subjects. Depending on the assessment, NAEP report cards provide national, state, and some district-level results, as well as results for different demographic groups. NAEP is also used to compare performance in the US to performance in other countries, for example, in contrast to the PISA and TIMSS tests. NAEP reports four levels of performance: Below Basic, Basic, Proficient, and Advanced.
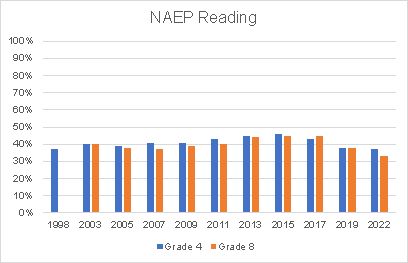
NAEP scores in New Hampshire tell a different story than the NH SAS and SAT scores. Looking at the chart below, the ELA scores for grades 4 and 8 were rising (ever so slightly) since 2003, but dropped in 2019, which was a year before the shutdown. Whatever happened in 2019 was not the shutdown.
NAEP normally tests in odd years, but they skipped 2021 and instead tested in 2022, with scores that were even lower than 2019 (although not significantly different statistically).
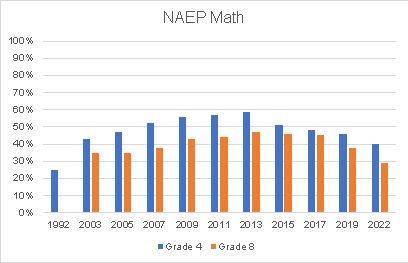
Looking at the chart below, math scores were on the rise for both grades 4 and 8 through 2013. Fourth grade scores (blue) dropped in 2015, continuing the downward trend through 2022. Eighth graders (orange) didn’t score as well as the 4th graders through 2013, stagnated from 2013-2017, but also took a downturn in 2019 that continued in 2022. Grade 8 looks like they took more of a shutdown hit than Grade 4, but both downswings started well before the shutdown.
Again, we should state clearly that all these NAEP scores are abysmal. They show that even at its high in 2015, 55% of grade 8 students were not reading at a proficient level (previous chart, above). In math (below), the peak was in 2013 with 41% of NH 4th grade students performing below proficiency. What’s more, if you go back far enough, the 2022 scores might just be part of a normal variance.
NH Per-Student Cost
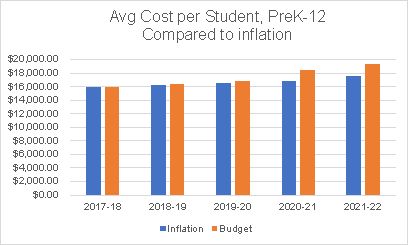
The growth in the yearly cost per pupil in NH’s public schools, preschool through grade 12, is shown in the chart below. For fun, we compare each yearly increase to inflation since 2017.
The blue bars show the per-student cost growing (from 2017) at the rate of inflation. The orange bars show the actual growth, which is considerably larger.
By 2021-22, the excess grew to 10% of the total (about $1,800 additional per child). And this is only going back to 2017. Imagine if we started the inflation analysis 40 years ago.
Again, keep in mind that this is the cost of a school system in which half the students are failing to reach even the lowest levels of proficiency in reading and math. The mind reels.
Conclusion
The narrative that the COVID pandemic shutdowns made things worse for public schools is not supported by the data. Scores were already decreasing (for reading) or stagnant (for math) before the pandemic started. It’s not like there was progress to be interrupted by the shutdown.
About half of kids in public schools are performing below the lowest levels of proficiency in reading and math. This has been true for a long time.
The one score on which public schools have made substantial gains is in dollars spent per student. The per-student cost of a K-12 education exceeds the median cost of a house in many school districts and rises beyond inflation every year.
By Dr. Jody Underwood
Jody served on the Croydon School Board from 2010-2023 in various roles, mostly as chair. Professionally, Dr. Underwood is a learning scientist who has conducted research and development around the use of technology for learning and assessment in the classroom since 1988. She also worked at Educational Testing Service (ETS) for 7 years, where she learned about how assessments work. She has a Ph.D. in Education from The Technion-Israel Institute of Technology. She and her husband moved to New Hampshire in 2007, where they live on a large off-the-grid property with their dog and are involved bonus grandparents to two homeschooled girls.